Figures are averages for that hour of each day in the time period analyzed.
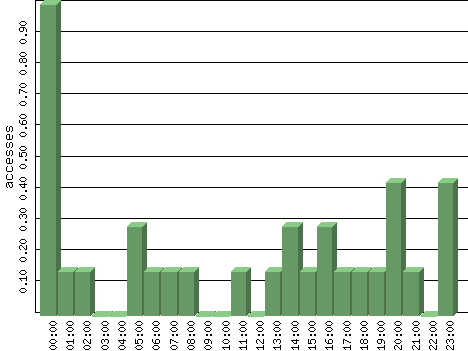
| Hour | Accesses | % | Bytes | % | Visits | % | Bits per Sec | Bytes per Sec |
|---|---|---|---|---|---|---|---|---|
| 00:00 | 1.00 | 22.58 | 1.00 | 0.00 | 0.00 | 0.00 | 0.00 | 0.00 |
| 01:00 | 0.14 | 3.23 | 628.71 | 1.69 | 0.00 | 0.00 | 1.40 | 0.17 |
| 02:00 | 0.14 | 3.23 | 310.00 | 0.83 | 0.00 | 0.00 | 0.69 | 0.09 |
| 03:00 | 0.00 | 0.00 | 0.00 | 0.00 | 0.00 | 0.00 | 0.00 | 0.00 |
| 04:00 | 0.00 | 0.00 | 0.00 | 0.00 | 0.00 | 0.00 | 0.00 | 0.00 |
| 05:00 | 0.29 | 6.45 | 8,388.86 | 22.57 | 0.00 | 0.00 | 18.64 | 2.33 |
| 06:00 | 0.14 | 3.23 | 522.86 | 1.41 | 0.00 | 0.00 | 1.16 | 0.15 |
| 07:00 | 0.14 | 3.23 | 2,028.00 | 5.46 | 0.00 | 0.00 | 4.51 | 0.56 |
| 08:00 | 0.14 | 3.23 | 320.71 | 0.86 | 0.00 | 0.00 | 0.71 | 0.09 |
| 09:00 | 0.00 | 0.00 | 0.00 | 0.00 | 0.00 | 0.00 | 0.00 | 0.00 |
| 10:00 | 0.00 | 0.00 | 0.00 | 0.00 | 0.00 | 0.00 | 0.00 | 0.00 |
| 11:00 | 0.14 | 3.23 | 468.71 | 1.26 | 0.00 | 0.00 | 1.04 | 0.13 |
| 12:00 | 0.00 | 0.00 | 0.00 | 0.00 | 0.00 | 0.00 | 0.00 | 0.00 |
| 13:00 | 0.14 | 3.23 | 299.14 | 0.80 | 0.00 | 0.00 | 0.66 | 0.08 |
| 14:00 | 0.29 | 6.45 | 4,026.86 | 10.83 | 0.21 | 18.75 | 8.95 | 1.12 |
| 15:00 | 0.14 | 3.23 | 2,035.29 | 5.48 | 0.00 | 0.00 | 4.52 | 0.57 |
| 16:00 | 0.29 | 6.45 | 4,341.14 | 11.68 | 0.00 | 0.00 | 9.65 | 1.21 |
| 17:00 | 0.14 | 3.23 | 278.14 | 0.75 | 0.00 | 0.00 | 0.62 | 0.08 |
| 18:00 | 0.14 | 3.23 | 359.00 | 0.97 | 0.00 | 0.00 | 0.80 | 0.10 |
| 19:00 | 0.14 | 3.23 | 352.14 | 0.95 | 0.00 | 0.00 | 0.78 | 0.10 |
| 20:00 | 0.43 | 9.68 | 5,188.57 | 13.96 | 0.64 | 56.25 | 11.53 | 1.44 |
| 21:00 | 0.14 | 3.23 | 293.57 | 0.79 | 0.00 | 0.00 | 0.65 | 0.08 |
| 22:00 | 0.00 | 0.00 | 0.00 | 0.00 | 0.00 | 0.00 | 0.00 | 0.00 |
| 23:00 | 0.43 | 9.68 | 7,322.57 | 19.70 | 0.29 | 25.00 | 16.27 | 2.03 |