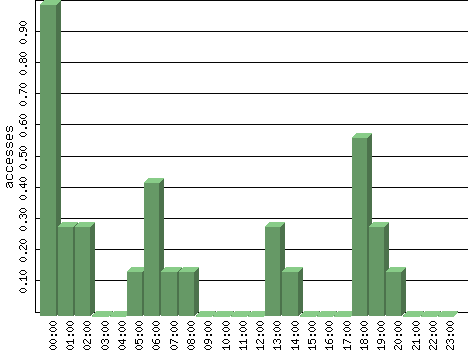
Figures are averages for that hour of each day in the time period analyzed.
| Hour | Accesses | % | Bytes | % | Visits | % | Bits per Sec | Bytes per Sec |
|---|---|---|---|---|---|---|---|---|
| 00:00 | 1.00 | 25.93 | 1.00 | 0.00 | 0.00 | 0.00 | 0.00 | 0.00 |
| 01:00 | 0.29 | 7.41 | 6,425.57 | 19.94 | 0.00 | 0.00 | 14.28 | 1.78 |
| 02:00 | 0.29 | 7.41 | 736.14 | 2.28 | 0.00 | 0.00 | 1.64 | 0.20 |
| 03:00 | 0.00 | 0.00 | 0.00 | 0.00 | 0.00 | 0.00 | 0.00 | 0.00 |
| 04:00 | 0.00 | 0.00 | 0.00 | 0.00 | 0.00 | 0.00 | 0.00 | 0.00 |
| 05:00 | 0.14 | 3.70 | 329.71 | 1.02 | 0.00 | 0.00 | 0.73 | 0.09 |
| 06:00 | 0.43 | 11.11 | 6,101.29 | 18.94 | 0.00 | 0.00 | 13.56 | 1.69 |
| 07:00 | 0.14 | 3.70 | 699.29 | 2.17 | 0.29 | 25.00 | 1.55 | 0.19 |
| 08:00 | 0.14 | 3.70 | 790.86 | 2.45 | 0.00 | 0.00 | 1.76 | 0.22 |
| 09:00 | 0.00 | 0.00 | 0.00 | 0.00 | 0.00 | 0.00 | 0.00 | 0.00 |
| 10:00 | 0.00 | 0.00 | 0.00 | 0.00 | 0.00 | 0.00 | 0.00 | 0.00 |
| 11:00 | 0.00 | 0.00 | 0.00 | 0.00 | 0.00 | 0.00 | 0.00 | 0.00 |
| 12:00 | 0.00 | 0.00 | 0.00 | 0.00 | 0.00 | 0.00 | 0.00 | 0.00 |
| 13:00 | 0.29 | 7.41 | 2,898.86 | 9.00 | 0.14 | 12.50 | 6.44 | 0.81 |
| 14:00 | 0.14 | 3.70 | 330.14 | 1.02 | 0.00 | 0.00 | 0.73 | 0.09 |
| 15:00 | 0.00 | 0.00 | 0.00 | 0.00 | 0.00 | 0.00 | 0.00 | 0.00 |
| 16:00 | 0.00 | 0.00 | 0.00 | 0.00 | 0.00 | 0.00 | 0.00 | 0.00 |
| 17:00 | 0.00 | 0.00 | 0.00 | 0.00 | 0.00 | 0.00 | 0.00 | 0.00 |
| 18:00 | 0.57 | 14.81 | 1,320.29 | 4.10 | 0.43 | 37.50 | 2.93 | 0.37 |
| 19:00 | 0.29 | 7.41 | 11,542.86 | 35.82 | 0.29 | 25.00 | 25.65 | 3.21 |
| 20:00 | 0.14 | 3.70 | 1,044.57 | 3.24 | 0.00 | 0.00 | 2.32 | 0.29 |
| 21:00 | 0.00 | 0.00 | 0.00 | 0.00 | 0.00 | 0.00 | 0.00 | 0.00 |
| 22:00 | 0.00 | 0.00 | 0.00 | 0.00 | 0.00 | 0.00 | 0.00 | 0.00 |
| 23:00 | 0.00 | 0.00 | 0.00 | 0.00 | 0.00 | 0.00 | 0.00 | 0.00 |