Figures are averages for that hour of each day in the time period analyzed.
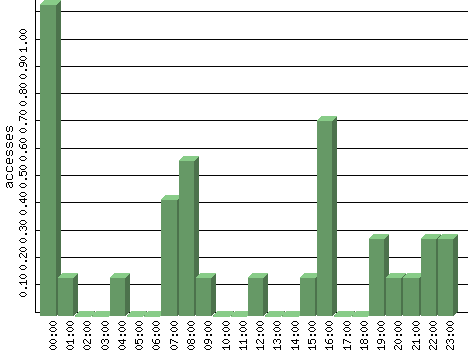
| Hour | Accesses | % | Bytes | % | Visits | % | Bits per Sec | Bytes per Sec |
|---|---|---|---|---|---|---|---|---|
| 00:00 | 1.14 | 24.24 | 305.43 | 0.76 | 0.00 | 0.00 | 0.68 | 0.08 |
| 01:00 | 0.14 | 3.03 | 1,326.57 | 3.32 | 0.00 | 0.00 | 2.95 | 0.37 |
| 02:00 | 0.00 | 0.00 | 0.00 | 0.00 | 0.00 | 0.00 | 0.00 | 0.00 |
| 03:00 | 0.00 | 0.00 | 0.00 | 0.00 | 0.00 | 0.00 | 0.00 | 0.00 |
| 04:00 | 0.14 | 3.03 | 575.14 | 1.44 | 0.00 | 0.00 | 1.28 | 0.16 |
| 05:00 | 0.00 | 0.00 | 0.00 | 0.00 | 0.00 | 0.00 | 0.00 | 0.00 |
| 06:00 | 0.00 | 0.00 | 0.00 | 0.00 | 0.00 | 0.00 | 0.00 | 0.00 |
| 07:00 | 0.43 | 9.09 | 1,426.71 | 3.57 | 0.00 | 0.00 | 3.17 | 0.40 |
| 08:00 | 0.57 | 12.12 | 12,728.71 | 31.84 | 0.14 | 14.29 | 28.29 | 3.54 |
| 09:00 | 0.14 | 3.03 | 694.29 | 1.74 | 0.00 | 0.00 | 1.54 | 0.19 |
| 10:00 | 0.00 | 0.00 | 0.00 | 0.00 | 0.00 | 0.00 | 0.00 | 0.00 |
| 11:00 | 0.00 | 0.00 | 0.00 | 0.00 | 0.00 | 0.00 | 0.00 | 0.00 |
| 12:00 | 0.14 | 3.03 | 368.14 | 0.92 | 0.00 | 0.00 | 0.82 | 0.10 |
| 13:00 | 0.00 | 0.00 | 0.00 | 0.00 | 0.00 | 0.00 | 0.00 | 0.00 |
| 14:00 | 0.00 | 0.00 | 0.00 | 0.00 | 0.00 | 0.00 | 0.00 | 0.00 |
| 15:00 | 0.14 | 3.03 | 584.14 | 1.46 | 0.00 | 0.00 | 1.30 | 0.16 |
| 16:00 | 0.71 | 15.15 | 3,152.86 | 7.89 | 0.29 | 28.57 | 7.01 | 0.88 |
| 17:00 | 0.00 | 0.00 | 0.00 | 0.00 | 0.00 | 0.00 | 0.00 | 0.00 |
| 18:00 | 0.00 | 0.00 | 0.00 | 0.00 | 0.00 | 0.00 | 0.00 | 0.00 |
| 19:00 | 0.29 | 6.06 | 7,447.57 | 18.63 | 0.00 | 0.00 | 16.55 | 2.07 |
| 20:00 | 0.14 | 3.03 | 341.57 | 0.85 | 0.00 | 0.00 | 0.76 | 0.09 |
| 21:00 | 0.14 | 3.03 | 362.43 | 0.91 | 0.00 | 0.00 | 0.81 | 0.10 |
| 22:00 | 0.29 | 6.06 | 9,977.71 | 24.96 | 0.29 | 28.57 | 22.17 | 2.77 |
| 23:00 | 0.29 | 6.06 | 683.71 | 1.71 | 0.29 | 28.57 | 1.52 | 0.19 |