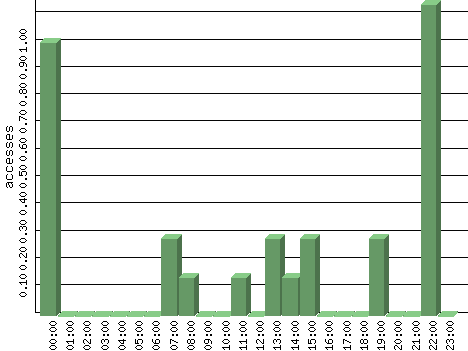
Figures are averages for that hour of each day in the time period analyzed.
| Hour | Accesses | % | Bytes | % | Visits | % | Bits per Sec | Bytes per Sec |
|---|---|---|---|---|---|---|---|---|
| 00:00 | 1.00 | 26.92 | 1.00 | 0.00 | 0.00 | 0.00 | 0.00 | 0.00 |
| 01:00 | 0.00 | 0.00 | 0.00 | 0.00 | 0.00 | 0.00 | 0.00 | 0.00 |
| 02:00 | 0.00 | 0.00 | 0.00 | 0.00 | 0.00 | 0.00 | 0.00 | 0.00 |
| 03:00 | 0.00 | 0.00 | 0.00 | 0.00 | 0.00 | 0.00 | 0.00 | 0.00 |
| 04:00 | 0.00 | 0.00 | 0.00 | 0.00 | 0.00 | 0.00 | 0.00 | 0.00 |
| 05:00 | 0.00 | 0.00 | 0.00 | 0.00 | 0.00 | 0.00 | 0.00 | 0.00 |
| 06:00 | 0.00 | 0.00 | 0.00 | 0.00 | 0.00 | 0.00 | 0.00 | 0.00 |
| 07:00 | 0.29 | 7.69 | 4,341.14 | 14.92 | 0.00 | 0.00 | 9.65 | 1.21 |
| 08:00 | 0.14 | 3.85 | 2,084.00 | 7.16 | 0.00 | 0.00 | 4.63 | 0.58 |
| 09:00 | 0.00 | 0.00 | 0.00 | 0.00 | 0.00 | 0.00 | 0.00 | 0.00 |
| 10:00 | 0.00 | 0.00 | 0.00 | 0.00 | 0.00 | 0.00 | 0.00 | 0.00 |
| 11:00 | 0.14 | 3.85 | 0.00 | 0.00 | 0.00 | 0.00 | 0.00 | 0.00 |
| 12:00 | 0.00 | 0.00 | 0.00 | 0.00 | 0.00 | 0.00 | 0.00 | 0.00 |
| 13:00 | 0.29 | 7.69 | 7,043.57 | 24.21 | 0.14 | 10.00 | 15.65 | 1.96 |
| 14:00 | 0.14 | 3.85 | 371.57 | 1.28 | 0.00 | 0.00 | 0.83 | 0.10 |
| 15:00 | 0.29 | 7.69 | 6,547.14 | 22.51 | 0.29 | 20.00 | 14.55 | 1.82 |
| 16:00 | 0.00 | 0.00 | 0.00 | 0.00 | 0.00 | 0.00 | 0.00 | 0.00 |
| 17:00 | 0.00 | 0.00 | 0.00 | 0.00 | 0.00 | 0.00 | 0.00 | 0.00 |
| 18:00 | 0.00 | 0.00 | 0.00 | 0.00 | 0.00 | 0.00 | 0.00 | 0.00 |
| 19:00 | 0.29 | 7.69 | 8,388.86 | 28.84 | 0.29 | 20.00 | 18.64 | 2.33 |
| 20:00 | 0.00 | 0.00 | 0.00 | 0.00 | 0.00 | 0.00 | 0.00 | 0.00 |
| 21:00 | 0.00 | 0.00 | 0.00 | 0.00 | 0.00 | 0.00 | 0.00 | 0.00 |
| 22:00 | 1.14 | 30.77 | 312.00 | 1.07 | 0.71 | 50.00 | 0.69 | 0.09 |
| 23:00 | 0.00 | 0.00 | 0.00 | 0.00 | 0.00 | 0.00 | 0.00 | 0.00 |