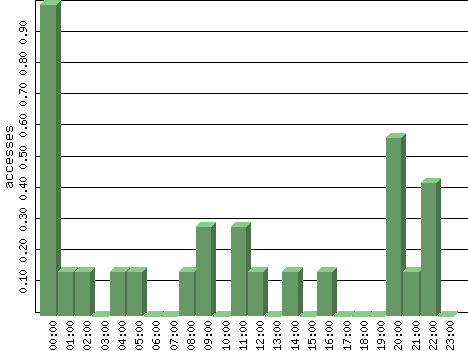
Figures are averages for that hour of each day in the time period analyzed.
| Hour | Accesses | % | Bytes | % | Visits | % | Bits per Sec | Bytes per Sec |
|---|---|---|---|---|---|---|---|---|
| 00:00 | 1.00 | 25.93 | 1.00 | 0.01 | 0.00 | 0.00 | 0.00 | 0.00 |
| 01:00 | 0.14 | 3.70 | 328.86 | 3.64 | 0.00 | 0.00 | 0.73 | 0.09 |
| 02:00 | 0.14 | 3.70 | 300.43 | 3.32 | 0.00 | 0.00 | 0.67 | 0.08 |
| 03:00 | 0.00 | 0.00 | 0.00 | 0.00 | 0.00 | 0.00 | 0.00 | 0.00 |
| 04:00 | 0.14 | 3.70 | 299.29 | 3.31 | 0.00 | 0.00 | 0.67 | 0.08 |
| 05:00 | 0.14 | 3.70 | 360.86 | 3.99 | 0.00 | 0.00 | 0.80 | 0.10 |
| 06:00 | 0.00 | 0.00 | 0.00 | 0.00 | 0.00 | 0.00 | 0.00 | 0.00 |
| 07:00 | 0.00 | 0.00 | 0.00 | 0.00 | 0.00 | 0.00 | 0.00 | 0.00 |
| 08:00 | 0.14 | 3.70 | 279.71 | 3.09 | 0.00 | 0.00 | 0.62 | 0.08 |
| 09:00 | 0.29 | 7.41 | 584.00 | 6.46 | 0.00 | 0.00 | 1.30 | 0.16 |
| 10:00 | 0.00 | 0.00 | 0.00 | 0.00 | 0.00 | 0.00 | 0.00 | 0.00 |
| 11:00 | 0.29 | 7.41 | 853.86 | 9.45 | 0.00 | 0.00 | 1.90 | 0.24 |
| 12:00 | 0.14 | 3.70 | 351.29 | 3.89 | 0.00 | 0.00 | 0.78 | 0.10 |
| 13:00 | 0.00 | 0.00 | 0.00 | 0.00 | 0.00 | 0.00 | 0.00 | 0.00 |
| 14:00 | 0.14 | 3.70 | 329.43 | 3.64 | 0.00 | 0.00 | 0.73 | 0.09 |
| 15:00 | 0.00 | 0.00 | 0.00 | 0.00 | 0.00 | 0.00 | 0.00 | 0.00 |
| 16:00 | 0.14 | 3.70 | 2,059.00 | 22.78 | 0.00 | 0.00 | 4.58 | 0.57 |
| 17:00 | 0.00 | 0.00 | 0.00 | 0.00 | 0.00 | 0.00 | 0.00 | 0.00 |
| 18:00 | 0.00 | 0.00 | 0.00 | 0.00 | 0.00 | 0.00 | 0.00 | 0.00 |
| 19:00 | 0.00 | 0.00 | 0.00 | 0.00 | 0.00 | 0.00 | 0.00 | 0.00 |
| 20:00 | 0.57 | 14.81 | 2,026.86 | 22.43 | 0.43 | 100.00 | 4.50 | 0.56 |
| 21:00 | 0.14 | 3.70 | 279.86 | 3.10 | 0.00 | 0.00 | 0.62 | 0.08 |
| 22:00 | 0.43 | 11.11 | 983.71 | 10.88 | 0.00 | 0.00 | 2.19 | 0.27 |
| 23:00 | 0.00 | 0.00 | 0.00 | 0.00 | 0.00 | 0.00 | 0.00 | 0.00 |