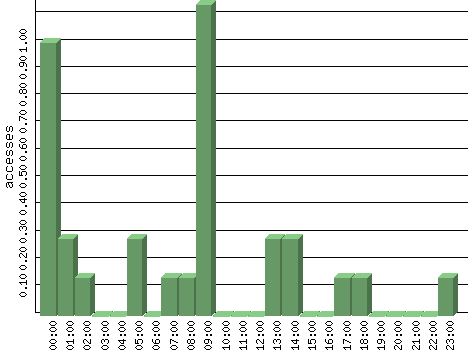
Figures are averages for that hour of each day in the time period analyzed.
| Hour | Accesses | % | Bytes | % | Visits | % | Bits per Sec | Bytes per Sec |
|---|---|---|---|---|---|---|---|---|
| 00:00 | 1.00 | 24.14 | 1.00 | 0.00 | 0.00 | 0.00 | 0.00 | 0.00 |
| 01:00 | 0.29 | 6.90 | 5,878.43 | 21.12 | 0.00 | 0.00 | 13.06 | 1.63 |
| 02:00 | 0.14 | 3.45 | 447.29 | 1.61 | 0.00 | 0.00 | 0.99 | 0.12 |
| 03:00 | 0.00 | 0.00 | 0.00 | 0.00 | 0.00 | 0.00 | 0.00 | 0.00 |
| 04:00 | 0.00 | 0.00 | 0.00 | 0.00 | 0.00 | 0.00 | 0.00 | 0.00 |
| 05:00 | 0.29 | 6.90 | 6,425.57 | 23.09 | 0.00 | 0.00 | 14.28 | 1.78 |
| 06:00 | 0.00 | 0.00 | 0.00 | 0.00 | 0.00 | 0.00 | 0.00 | 0.00 |
| 07:00 | 0.14 | 3.45 | 1,044.57 | 3.75 | 0.00 | 0.00 | 2.32 | 0.29 |
| 08:00 | 0.14 | 3.45 | 3,439.29 | 12.36 | 0.21 | 18.75 | 7.64 | 0.96 |
| 09:00 | 1.14 | 27.59 | 2,250.86 | 8.09 | 0.21 | 18.75 | 5.00 | 0.63 |
| 10:00 | 0.00 | 0.00 | 0.00 | 0.00 | 0.00 | 0.00 | 0.00 | 0.00 |
| 11:00 | 0.00 | 0.00 | 0.00 | 0.00 | 0.00 | 0.00 | 0.00 | 0.00 |
| 12:00 | 0.00 | 0.00 | 0.00 | 0.00 | 0.00 | 0.00 | 0.00 | 0.00 |
| 13:00 | 0.29 | 6.90 | 6,299.00 | 22.63 | 0.21 | 18.75 | 14.00 | 1.75 |
| 14:00 | 0.29 | 6.90 | 659.86 | 2.37 | 0.29 | 25.00 | 1.47 | 0.18 |
| 15:00 | 0.00 | 0.00 | 0.00 | 0.00 | 0.00 | 0.00 | 0.00 | 0.00 |
| 16:00 | 0.00 | 0.00 | 0.00 | 0.00 | 0.00 | 0.00 | 0.00 | 0.00 |
| 17:00 | 0.14 | 3.45 | 331.14 | 1.19 | 0.00 | 0.00 | 0.74 | 0.09 |
| 18:00 | 0.14 | 3.45 | 354.14 | 1.27 | 0.00 | 0.00 | 0.79 | 0.10 |
| 19:00 | 0.00 | 0.00 | 0.00 | 0.00 | 0.00 | 0.00 | 0.00 | 0.00 |
| 20:00 | 0.00 | 0.00 | 0.00 | 0.00 | 0.00 | 0.00 | 0.00 | 0.00 |
| 21:00 | 0.00 | 0.00 | 0.00 | 0.00 | 0.00 | 0.00 | 0.00 | 0.00 |
| 22:00 | 0.00 | 0.00 | 0.00 | 0.00 | 0.00 | 0.00 | 0.00 | 0.00 |
| 23:00 | 0.14 | 3.45 | 699.29 | 2.51 | 0.21 | 18.75 | 1.55 | 0.19 |