Figures are averages for that hour of each day in the time period analyzed.
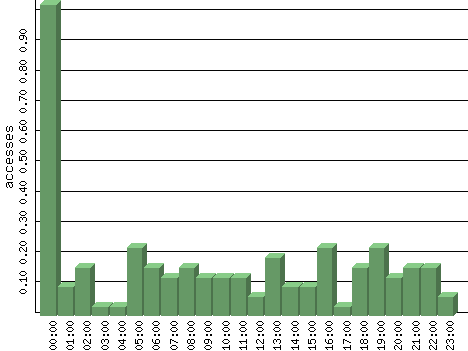
| Hour | Accesses | % | Bytes | % | Visits | % | Bits per Sec | Bytes per Sec |
|---|---|---|---|---|---|---|---|---|
| 00:00 | 1.03 | 25.60 | 69.74 | 0.20 | 0.00 | 0.00 | 0.15 | 0.02 |
| 01:00 | 0.10 | 2.40 | 1,750.48 | 5.13 | 0.00 | 0.00 | 3.89 | 0.49 |
| 02:00 | 0.16 | 4.00 | 426.35 | 1.25 | 0.00 | 0.00 | 0.95 | 0.12 |
| 03:00 | 0.03 | 0.80 | 1,228.77 | 3.60 | 0.00 | 0.00 | 2.73 | 0.34 |
| 04:00 | 0.03 | 0.80 | 129.87 | 0.38 | 0.00 | 0.00 | 0.29 | 0.04 |
| 05:00 | 0.23 | 5.60 | 1,901.39 | 5.57 | 0.00 | 0.00 | 4.23 | 0.53 |
| 06:00 | 0.16 | 4.00 | 1,511.13 | 4.42 | 0.00 | 0.00 | 3.36 | 0.42 |
| 07:00 | 0.13 | 3.20 | 480.06 | 1.41 | 0.06 | 7.14 | 1.07 | 0.13 |
| 08:00 | 0.16 | 4.00 | 3,052.81 | 8.94 | 0.03 | 3.57 | 6.78 | 0.85 |
| 09:00 | 0.13 | 3.20 | 1,619.52 | 4.74 | 0.03 | 3.57 | 3.60 | 0.45 |
| 10:00 | 0.13 | 3.20 | 742.29 | 2.17 | 0.03 | 3.57 | 1.65 | 0.21 |
| 11:00 | 0.13 | 3.20 | 258.48 | 0.76 | 0.00 | 0.00 | 0.57 | 0.07 |
| 12:00 | 0.06 | 1.60 | 149.06 | 0.44 | 0.00 | 0.00 | 0.33 | 0.04 |
| 13:00 | 0.19 | 4.80 | 2,463.77 | 7.21 | 0.13 | 14.29 | 5.48 | 0.68 |
| 14:00 | 0.10 | 2.40 | 1,401.94 | 4.10 | 0.00 | 0.00 | 3.12 | 0.39 |
| 15:00 | 0.10 | 2.40 | 282.52 | 0.83 | 0.00 | 0.00 | 0.63 | 0.08 |
| 16:00 | 0.23 | 5.60 | 861.13 | 2.52 | 0.06 | 7.14 | 1.91 | 0.24 |
| 17:00 | 0.03 | 0.80 | 69.52 | 0.20 | 0.00 | 0.00 | 0.15 | 0.02 |
| 18:00 | 0.16 | 4.00 | 469.10 | 1.37 | 0.10 | 10.71 | 1.04 | 0.13 |
| 19:00 | 0.23 | 5.60 | 6,966.74 | 20.40 | 0.13 | 14.29 | 15.48 | 1.94 |
| 20:00 | 0.13 | 3.20 | 2,810.74 | 8.23 | 0.06 | 7.14 | 6.25 | 0.78 |
| 21:00 | 0.16 | 4.00 | 1,019.90 | 2.99 | 0.06 | 7.14 | 2.27 | 0.28 |
| 22:00 | 0.16 | 4.00 | 4,332.74 | 12.69 | 0.13 | 14.29 | 9.63 | 1.20 |
| 23:00 | 0.06 | 1.60 | 154.39 | 0.45 | 0.06 | 7.14 | 0.34 | 0.04 |