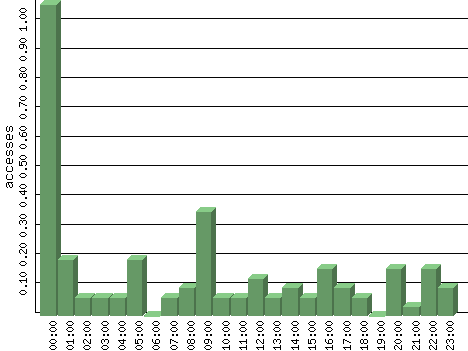
Figures are averages for that hour of each day in the time period analyzed.
| Hour | Accesses | % | Bytes | % | Visits | % | Bits per Sec | Bytes per Sec |
|---|---|---|---|---|---|---|---|---|
| 00:00 | 1.06 | 31.13 | 134.74 | 0.82 | 0.00 | 0.00 | 0.30 | 0.04 |
| 01:00 | 0.19 | 5.66 | 1,769.42 | 10.77 | 0.00 | 0.00 | 3.93 | 0.49 |
| 02:00 | 0.06 | 1.89 | 168.84 | 1.03 | 0.00 | 0.00 | 0.38 | 0.05 |
| 03:00 | 0.06 | 1.89 | 121.03 | 0.74 | 0.03 | 3.85 | 0.27 | 0.03 |
| 04:00 | 0.06 | 1.89 | 223.90 | 1.36 | 0.00 | 0.00 | 0.50 | 0.06 |
| 05:00 | 0.19 | 5.66 | 1,732.94 | 10.55 | 0.00 | 0.00 | 3.85 | 0.48 |
| 06:00 | 0.00 | 0.00 | 0.00 | 0.00 | 0.00 | 0.00 | 0.00 | 0.00 |
| 07:00 | 0.06 | 1.89 | 285.74 | 1.74 | 0.05 | 5.77 | 0.63 | 0.08 |
| 08:00 | 0.10 | 2.83 | 1,014.90 | 6.18 | 0.05 | 5.77 | 2.26 | 0.28 |
| 09:00 | 0.35 | 10.38 | 781.48 | 4.76 | 0.05 | 5.77 | 1.74 | 0.22 |
| 10:00 | 0.06 | 1.89 | 262.26 | 1.60 | 0.03 | 3.85 | 0.58 | 0.07 |
| 11:00 | 0.06 | 1.89 | 192.81 | 1.17 | 0.00 | 0.00 | 0.43 | 0.05 |
| 12:00 | 0.13 | 3.77 | 353.55 | 2.15 | 0.00 | 0.00 | 0.79 | 0.10 |
| 13:00 | 0.06 | 1.89 | 1,422.35 | 8.66 | 0.05 | 5.77 | 3.16 | 0.40 |
| 14:00 | 0.10 | 2.83 | 223.39 | 1.36 | 0.06 | 7.69 | 0.50 | 0.06 |
| 15:00 | 0.06 | 1.89 | 169.10 | 1.03 | 0.10 | 11.54 | 0.38 | 0.05 |
| 16:00 | 0.16 | 4.72 | 1,959.29 | 11.93 | 0.06 | 7.69 | 4.35 | 0.54 |
| 17:00 | 0.10 | 2.83 | 232.65 | 1.42 | 0.03 | 3.85 | 0.52 | 0.06 |
| 18:00 | 0.06 | 1.89 | 150.13 | 0.91 | 0.05 | 5.77 | 0.33 | 0.04 |
| 19:00 | 0.00 | 0.00 | 0.00 | 0.00 | 0.00 | 0.00 | 0.00 | 0.00 |
| 20:00 | 0.16 | 4.72 | 538.13 | 3.28 | 0.10 | 11.54 | 1.20 | 0.15 |
| 21:00 | 0.03 | 0.94 | 63.19 | 0.38 | 0.00 | 0.00 | 0.14 | 0.02 |
| 22:00 | 0.16 | 4.72 | 2,631.81 | 16.02 | 0.06 | 7.69 | 5.85 | 0.73 |
| 23:00 | 0.10 | 2.83 | 1,996.58 | 12.15 | 0.11 | 13.46 | 4.44 | 0.55 |