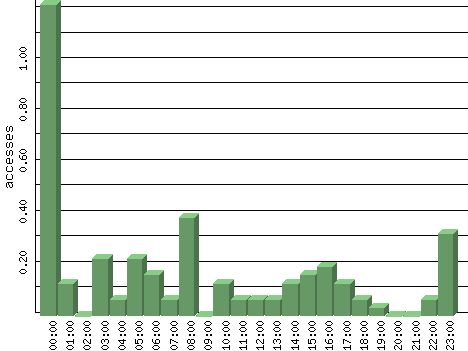
Figures are averages for that hour of each day in the time period analyzed.
| Hour | Accesses | % | Bytes | % | Visits | % | Bits per Sec | Bytes per Sec |
|---|---|---|---|---|---|---|---|---|
| 00:00 | 1.23 | 31.40 | 593.35 | 2.46 | 0.00 | 0.00 | 1.32 | 0.16 |
| 01:00 | 0.13 | 3.31 | 266.87 | 1.11 | 0.08 | 5.56 | 0.59 | 0.07 |
| 02:00 | 0.00 | 0.00 | 0.00 | 0.00 | 0.00 | 0.00 | 0.00 | 0.00 |
| 03:00 | 0.23 | 5.79 | 1,338.61 | 5.55 | 0.00 | 0.00 | 2.97 | 0.37 |
| 04:00 | 0.06 | 1.65 | 917.52 | 3.80 | 0.03 | 2.22 | 2.04 | 0.25 |
| 05:00 | 0.23 | 5.79 | 920.13 | 3.81 | 0.05 | 3.33 | 2.04 | 0.26 |
| 06:00 | 0.16 | 4.13 | 2,667.03 | 11.05 | 0.03 | 2.22 | 5.93 | 0.74 |
| 07:00 | 0.06 | 1.65 | 120.26 | 0.50 | 0.00 | 0.00 | 0.27 | 0.03 |
| 08:00 | 0.39 | 9.92 | 1,799.90 | 7.46 | 0.06 | 4.44 | 4.00 | 0.50 |
| 09:00 | 0.00 | 0.00 | 0.00 | 0.00 | 0.00 | 0.00 | 0.00 | 0.00 |
| 10:00 | 0.13 | 3.31 | 1,609.16 | 6.67 | 0.09 | 6.30 | 3.58 | 0.45 |
| 11:00 | 0.06 | 1.65 | 229.45 | 0.95 | 0.00 | 0.00 | 0.51 | 0.06 |
| 12:00 | 0.06 | 1.65 | 246.55 | 1.02 | 0.06 | 4.44 | 0.55 | 0.07 |
| 13:00 | 0.06 | 1.65 | 2,806.45 | 11.63 | 0.03 | 2.22 | 6.24 | 0.78 |
| 14:00 | 0.13 | 3.31 | 3,072.45 | 12.73 | 0.11 | 7.41 | 6.83 | 0.85 |
| 15:00 | 0.16 | 4.13 | 1,804.45 | 7.48 | 0.12 | 8.52 | 4.01 | 0.50 |
| 16:00 | 0.19 | 4.96 | 477.19 | 1.98 | 0.22 | 14.81 | 1.06 | 0.13 |
| 17:00 | 0.13 | 3.31 | 346.03 | 1.43 | 0.06 | 4.44 | 0.77 | 0.10 |
| 18:00 | 0.06 | 1.65 | 130.61 | 0.54 | 0.06 | 4.44 | 0.29 | 0.04 |
| 19:00 | 0.03 | 0.83 | 74.26 | 0.31 | 0.00 | 0.00 | 0.17 | 0.02 |
| 20:00 | 0.00 | 0.00 | 0.00 | 0.00 | 0.00 | 0.00 | 0.00 | 0.00 |
| 21:00 | 0.00 | 0.00 | 0.00 | 0.00 | 0.00 | 0.00 | 0.00 | 0.00 |
| 22:00 | 0.06 | 1.65 | 146.23 | 0.61 | 0.06 | 4.44 | 0.32 | 0.04 |
| 23:00 | 0.32 | 8.26 | 4,570.26 | 18.93 | 0.37 | 25.19 | 10.16 | 1.27 |