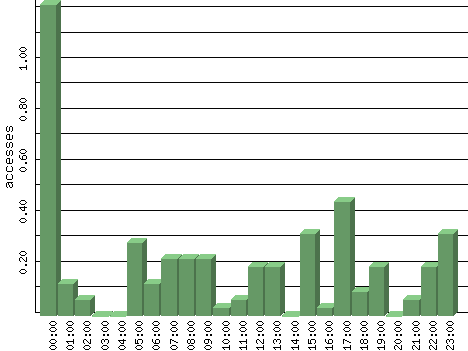
Figures are averages for that hour of each day in the time period analyzed.
| Hour | Accesses | % | Bytes | % | Visits | % | Bits per Sec | Bytes per Sec |
|---|---|---|---|---|---|---|---|---|
| 00:00 | 1.23 | 26.21 | 826.55 | 2.53 | 0.00 | 0.00 | 1.84 | 0.23 |
| 01:00 | 0.13 | 2.76 | 2,958.81 | 9.05 | 0.00 | 0.00 | 6.58 | 0.82 |
| 02:00 | 0.06 | 1.38 | 125.94 | 0.39 | 0.00 | 0.00 | 0.28 | 0.03 |
| 03:00 | 0.00 | 0.00 | 0.00 | 0.00 | 0.00 | 0.00 | 0.00 | 0.00 |
| 04:00 | 0.00 | 0.00 | 0.00 | 0.00 | 0.00 | 0.00 | 0.00 | 0.00 |
| 05:00 | 0.29 | 6.21 | 3,059.00 | 9.36 | 0.00 | 0.00 | 6.80 | 0.85 |
| 06:00 | 0.13 | 2.76 | 1,568.81 | 4.80 | 0.03 | 1.92 | 3.49 | 0.44 |
| 07:00 | 0.23 | 4.83 | 889.58 | 2.72 | 0.06 | 3.85 | 1.98 | 0.25 |
| 08:00 | 0.23 | 4.83 | 2,218.65 | 6.79 | 0.08 | 4.81 | 4.93 | 0.62 |
| 09:00 | 0.23 | 4.83 | 3,048.52 | 9.33 | 0.06 | 3.85 | 6.77 | 0.85 |
| 10:00 | 0.03 | 0.69 | 776.61 | 2.38 | 0.00 | 0.00 | 1.73 | 0.22 |
| 11:00 | 0.06 | 1.38 | 148.84 | 0.46 | 0.03 | 1.92 | 0.33 | 0.04 |
| 12:00 | 0.19 | 4.14 | 1,645.52 | 5.03 | 0.10 | 5.77 | 3.66 | 0.46 |
| 13:00 | 0.19 | 4.14 | 2,316.29 | 7.09 | 0.06 | 3.85 | 5.15 | 0.64 |
| 14:00 | 0.00 | 0.00 | 0.00 | 0.00 | 0.00 | 0.00 | 0.00 | 0.00 |
| 15:00 | 0.32 | 6.90 | 3,269.74 | 10.00 | 0.24 | 14.42 | 7.27 | 0.91 |
| 16:00 | 0.03 | 0.69 | 88.74 | 0.27 | 0.00 | 0.00 | 0.20 | 0.02 |
| 17:00 | 0.45 | 9.66 | 518.48 | 1.59 | 0.29 | 17.31 | 1.15 | 0.14 |
| 18:00 | 0.10 | 2.07 | 2,717.32 | 8.31 | 0.06 | 3.85 | 6.04 | 0.75 |
| 19:00 | 0.19 | 4.14 | 2,022.35 | 6.19 | 0.19 | 11.54 | 4.49 | 0.56 |
| 20:00 | 0.00 | 0.00 | 0.00 | 0.00 | 0.00 | 0.00 | 0.00 | 0.00 |
| 21:00 | 0.06 | 1.38 | 135.71 | 0.42 | 0.06 | 3.85 | 0.30 | 0.04 |
| 22:00 | 0.19 | 4.14 | 3,222.32 | 9.86 | 0.13 | 7.69 | 7.16 | 0.90 |
| 23:00 | 0.32 | 6.90 | 1,131.39 | 3.46 | 0.26 | 15.38 | 2.51 | 0.31 |