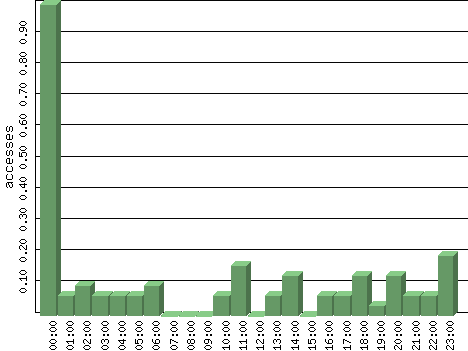
Figures are averages for that hour of each day in the time period analyzed.
| Hour | Accesses | % | Bytes | % | Visits | % | Bits per Sec | Bytes per Sec |
|---|---|---|---|---|---|---|---|---|
| 00:00 | 1.00 | 38.27 | 1.00 | 0.01 | 0.00 | 0.00 | 0.00 | 0.00 |
| 01:00 | 0.06 | 2.47 | 220.03 | 1.43 | 0.00 | 0.00 | 0.49 | 0.06 |
| 02:00 | 0.10 | 3.70 | 106.45 | 0.69 | 0.03 | 3.85 | 0.24 | 0.03 |
| 03:00 | 0.06 | 2.47 | 149.03 | 0.97 | 0.00 | 0.00 | 0.33 | 0.04 |
| 04:00 | 0.06 | 2.47 | 281.29 | 1.83 | 0.00 | 0.00 | 0.63 | 0.08 |
| 05:00 | 0.06 | 2.47 | 158.61 | 1.03 | 0.00 | 0.00 | 0.35 | 0.04 |
| 06:00 | 0.10 | 3.70 | 1,745.42 | 11.35 | 0.00 | 0.00 | 3.88 | 0.48 |
| 07:00 | 0.00 | 0.00 | 0.00 | 0.00 | 0.00 | 0.00 | 0.00 | 0.00 |
| 08:00 | 0.00 | 0.00 | 0.00 | 0.00 | 0.00 | 0.00 | 0.00 | 0.00 |
| 09:00 | 0.00 | 0.00 | 0.00 | 0.00 | 0.00 | 0.00 | 0.00 | 0.00 |
| 10:00 | 0.06 | 2.47 | 31.90 | 0.21 | 0.06 | 7.69 | 0.07 | 0.01 |
| 11:00 | 0.16 | 6.17 | 2,553.74 | 16.61 | 0.04 | 4.62 | 5.67 | 0.71 |
| 12:00 | 0.00 | 0.00 | 0.00 | 0.00 | 0.00 | 0.00 | 0.00 | 0.00 |
| 13:00 | 0.06 | 2.47 | 130.61 | 0.85 | 0.04 | 5.13 | 0.29 | 0.04 |
| 14:00 | 0.13 | 4.94 | 2,536.00 | 16.49 | 0.14 | 16.15 | 5.64 | 0.70 |
| 15:00 | 0.00 | 0.00 | 0.00 | 0.00 | 0.00 | 0.00 | 0.00 | 0.00 |
| 16:00 | 0.06 | 2.47 | 529.84 | 3.45 | 0.06 | 7.69 | 1.18 | 0.15 |
| 17:00 | 0.06 | 2.47 | 2,498.19 | 16.25 | 0.03 | 3.85 | 5.55 | 0.69 |
| 18:00 | 0.13 | 4.94 | 389.94 | 2.54 | 0.08 | 9.74 | 0.87 | 0.11 |
| 19:00 | 0.03 | 1.23 | 82.10 | 0.53 | 0.00 | 0.00 | 0.18 | 0.02 |
| 20:00 | 0.13 | 4.94 | 1,083.65 | 7.05 | 0.10 | 11.54 | 2.41 | 0.30 |
| 21:00 | 0.06 | 2.47 | 88.55 | 0.58 | 0.04 | 5.13 | 0.20 | 0.02 |
| 22:00 | 0.06 | 2.47 | 208.74 | 1.36 | 0.08 | 9.23 | 0.46 | 0.06 |
| 23:00 | 0.19 | 7.41 | 2,582.03 | 16.79 | 0.13 | 15.38 | 5.74 | 0.72 |