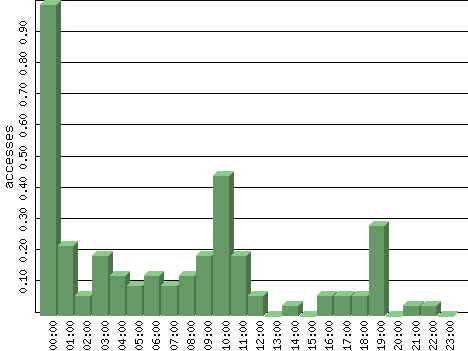
Figures are averages for that hour of each day in the time period analyzed.
| Hour | Accesses | % | Bytes | % | Visits | % | Bits per Sec | Bytes per Sec |
|---|---|---|---|---|---|---|---|---|
| 00:00 | 1.00 | 28.18 | 1.00 | 0.01 | 0.00 | 0.00 | 0.00 | 0.00 |
| 01:00 | 0.23 | 6.36 | 955.71 | 9.47 | 0.00 | 0.00 | 2.12 | 0.27 |
| 02:00 | 0.06 | 1.82 | 300.39 | 2.98 | 0.00 | 0.00 | 0.67 | 0.08 |
| 03:00 | 0.19 | 5.45 | 788.94 | 7.82 | 0.00 | 0.00 | 1.75 | 0.22 |
| 04:00 | 0.13 | 3.64 | 183.19 | 1.81 | 0.00 | 0.00 | 0.41 | 0.05 |
| 05:00 | 0.10 | 2.73 | 494.87 | 4.90 | 0.00 | 0.00 | 1.10 | 0.14 |
| 06:00 | 0.13 | 3.64 | 451.32 | 4.47 | 0.03 | 14.29 | 1.00 | 0.13 |
| 07:00 | 0.10 | 2.73 | 493.23 | 4.89 | 0.00 | 0.00 | 1.10 | 0.14 |
| 08:00 | 0.13 | 3.64 | 332.81 | 3.30 | 0.10 | 42.86 | 0.74 | 0.09 |
| 09:00 | 0.19 | 5.45 | 783.55 | 7.76 | 0.00 | 0.00 | 1.74 | 0.22 |
| 10:00 | 0.45 | 12.73 | 2,122.94 | 21.03 | 0.03 | 14.29 | 4.72 | 0.59 |
| 11:00 | 0.19 | 5.45 | 714.23 | 7.08 | 0.00 | 0.00 | 1.59 | 0.20 |
| 12:00 | 0.06 | 1.82 | 271.16 | 2.69 | 0.00 | 0.00 | 0.60 | 0.08 |
| 13:00 | 0.00 | 0.00 | 0.00 | 0.00 | 0.00 | 0.00 | 0.00 | 0.00 |
| 14:00 | 0.03 | 0.91 | 164.81 | 1.63 | 0.00 | 0.00 | 0.37 | 0.05 |
| 15:00 | 0.00 | 0.00 | 0.00 | 0.00 | 0.00 | 0.00 | 0.00 | 0.00 |
| 16:00 | 0.06 | 1.82 | 271.16 | 2.69 | 0.00 | 0.00 | 0.60 | 0.08 |
| 17:00 | 0.06 | 1.82 | 300.39 | 2.98 | 0.00 | 0.00 | 0.67 | 0.08 |
| 18:00 | 0.06 | 1.82 | 300.39 | 2.98 | 0.00 | 0.00 | 0.67 | 0.08 |
| 19:00 | 0.29 | 8.18 | 945.45 | 9.37 | 0.06 | 28.57 | 2.10 | 0.26 |
| 20:00 | 0.00 | 0.00 | 0.00 | 0.00 | 0.00 | 0.00 | 0.00 | 0.00 |
| 21:00 | 0.03 | 0.91 | 135.58 | 1.34 | 0.00 | 0.00 | 0.30 | 0.04 |
| 22:00 | 0.03 | 0.91 | 83.77 | 0.83 | 0.00 | 0.00 | 0.19 | 0.02 |
| 23:00 | 0.00 | 0.00 | 0.00 | 0.00 | 0.00 | 0.00 | 0.00 | 0.00 |