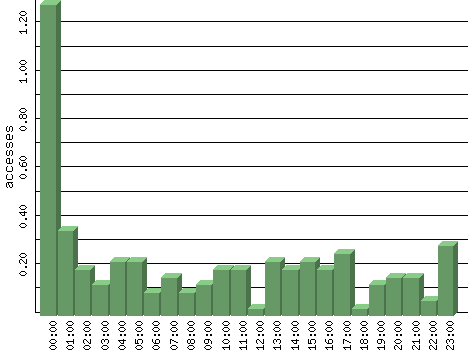
Figures are averages for that hour of each day in the time period analyzed.
| Hour | Accesses | % | Bytes | % | Visits | % | Bits per Sec | Bytes per Sec |
|---|---|---|---|---|---|---|---|---|
| 00:00 | 1.29 | 24.54 | 580.10 | 1.92 | 0.00 | 0.00 | 1.29 | 0.16 |
| 01:00 | 0.35 | 6.75 | 2,672.94 | 8.84 | 0.00 | 0.00 | 5.94 | 0.74 |
| 02:00 | 0.19 | 3.68 | 712.55 | 2.36 | 0.00 | 0.00 | 1.58 | 0.20 |
| 03:00 | 0.13 | 2.45 | 630.00 | 2.08 | 0.00 | 0.00 | 1.40 | 0.17 |
| 04:00 | 0.23 | 4.29 | 991.23 | 3.28 | 0.06 | 7.69 | 2.20 | 0.28 |
| 05:00 | 0.23 | 4.29 | 938.97 | 3.11 | 0.00 | 0.00 | 2.09 | 0.26 |
| 06:00 | 0.10 | 1.84 | 259.42 | 0.86 | 0.00 | 0.00 | 0.58 | 0.07 |
| 07:00 | 0.16 | 3.07 | 1,382.90 | 4.57 | 0.00 | 0.00 | 3.07 | 0.38 |
| 08:00 | 0.10 | 1.84 | 212.81 | 0.70 | 0.00 | 0.00 | 0.47 | 0.06 |
| 09:00 | 0.13 | 2.45 | 1,542.81 | 5.10 | 0.00 | 0.00 | 3.43 | 0.43 |
| 10:00 | 0.19 | 3.68 | 2,992.39 | 9.90 | 0.05 | 6.41 | 6.65 | 0.83 |
| 11:00 | 0.19 | 3.68 | 1,993.84 | 6.59 | 0.00 | 0.00 | 4.43 | 0.55 |
| 12:00 | 0.03 | 0.61 | 164.81 | 0.55 | 0.06 | 7.69 | 0.37 | 0.05 |
| 13:00 | 0.23 | 4.29 | 914.45 | 3.02 | 0.05 | 6.41 | 2.03 | 0.25 |
| 14:00 | 0.19 | 3.68 | 1,236.00 | 4.09 | 0.00 | 0.00 | 2.75 | 0.34 |
| 15:00 | 0.23 | 4.29 | 1,687.23 | 5.58 | 0.04 | 5.13 | 3.75 | 0.47 |
| 16:00 | 0.19 | 3.68 | 4,362.81 | 14.43 | 0.00 | 0.00 | 9.70 | 1.21 |
| 17:00 | 0.26 | 4.91 | 1,604.68 | 5.31 | 0.18 | 21.79 | 3.57 | 0.45 |
| 18:00 | 0.03 | 0.61 | 135.58 | 0.45 | 0.08 | 9.62 | 0.30 | 0.04 |
| 19:00 | 0.13 | 2.45 | 667.32 | 2.21 | 0.00 | 0.00 | 1.48 | 0.19 |
| 20:00 | 0.16 | 3.07 | 1,715.87 | 5.68 | 0.08 | 9.62 | 3.81 | 0.48 |
| 21:00 | 0.16 | 3.07 | 736.35 | 2.44 | 0.13 | 15.38 | 1.64 | 0.20 |
| 22:00 | 0.06 | 1.23 | 143.29 | 0.47 | 0.00 | 0.00 | 0.32 | 0.04 |
| 23:00 | 0.29 | 5.52 | 1,955.61 | 6.47 | 0.09 | 10.26 | 4.35 | 0.54 |